Interactive Time Graph
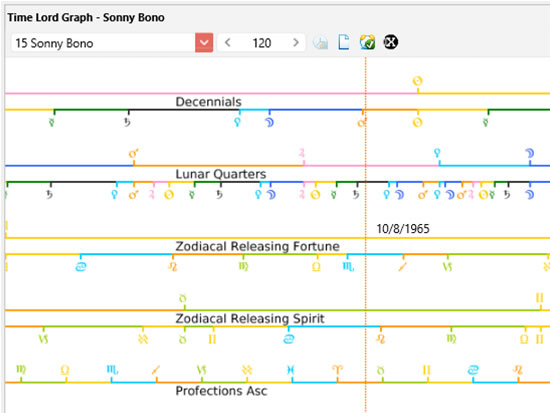
The Time Graph is capable of showing all Hellenistic time lord systems in Delphic Oracle for easy cross comparison. Any number of time lord procedures can be selected and placed in any order with user defined resolution, size and calculation length. When your mouse is over the graph, a dotted line will appear showing the date represented by the exact position of the mouse. The vertical line can be used to precisely guide your eye to see what else is going on in various other time lord systems at the same moment in time (shown below).
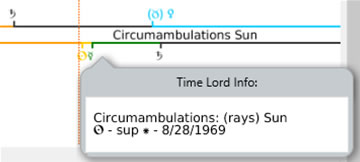
This graph is not just capable of showing different time lord systems together, but will show time lord hints when you hover over the glyphs which show the onset of periods, giving more info about the period. This graph is also able to automatically generate user defined multi-wheel display by a single click anywhere on the graph! This will save you lots of trouble compared to other software which requires individual chart setup for comparison. At the same time, you can also generate time wheels in the display. This allows for a very flexible research interface. While you can click anywhere on the Time Graph, when the mouse is hovering over a hint as you click (as shown below) it will focus precisely on the exact onset of that time period, generating charts for that moment in time.
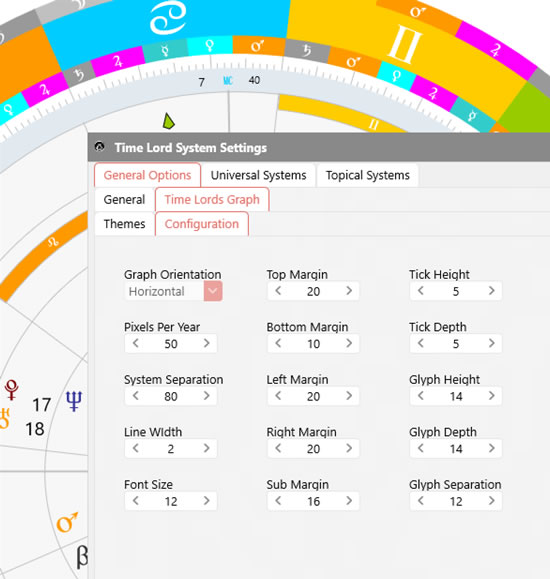
The options for the time graph are many and have to do with spacing, thickness of lines, time lord labels and font sizes as you can see below.
There's also settings for Time Graph Themes which preserve your order, resolution and size settings that will allow you to switch between time graph displays simply by double cliking on a theme! Why would you want to do this? When I work with annual divisions, I prefer to have a greater resolution to be able to see the divisions better, whereas when working with general time lord systems such as decennials and quarters of the Moon, I prefer a lower resolution so that I can compare parallel periods decades apart. The Time Graph Theme settings are shown below...
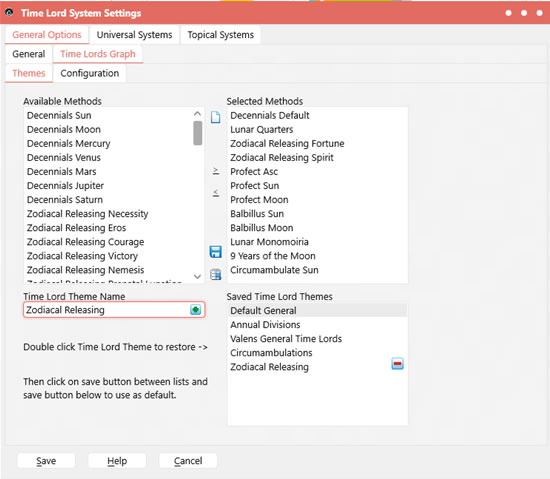
There are currently 82 different time graph time line options that can be selected under the "Available Methods" heading in the picture at top left. You can drag them to the right then drag them in order up/down in the list in the order you want them displayed. You can then switch displays by pressing F5 and double clicking a Time Lord Theme (lower right in the above pic) and clicking save, then redrawing. No need to redo the Configuration tab options again!
Why is this important?
Unlike many companies who hire programmers to write interfaces knowing only the bare essentials of what they are to program, I'm an astrologer with 40+ years of experience who also happens to be a programmer. I actually use this in my own research and having worked with Robert Schmidt, I know what needs to be done and how best to do it. One of the ways that we deciphered what was going on in the Zodiacal Releasing procedure was through the sort of cross comparison of time periods as shown above. For instance, I had a period when I was living on the farm at the beginning of my life under the Moon Lunar Quarters general and when that period happened again I returned to the place I was back in 1961. This suggests an extrapolation as to what will happen in the future because then I can go back to 1967 and see when I will be faced with the similar issues that caused the relocation of 1967 in the future. There are literally thousands of parallels that can be found if you know your dates well, then you will be able to extrapolate into the future.
At the same time you will want to know what is going on in other time lord procedures to see if patterns overlap. For instance, I have a strong pattern with ZR spirit that is fortunate under Leo periods because the Sun is in the 10th in Leo without being seen by the rays of the malefics. If this same period was to coincide with the 1967 = 2018 relocation, then we can guess relocation due to career opportunity (it doesn't in this case). The more patterns that you recognize, the more you will be able to fill in the blanks and see what is likely to transpire.
It has taken me years to get to this place of understanding and ironically, the more you understand, the more difficult it will become for you to talk about it (due to confidentiality and your close connections that affect others). It may sound like I believe that everything is fated, but that's not the case IMO. I believe that what's really going on is that we exist in temporal fields that behave like Suslin trees (see diamond principle in set theory) with various ranges of manifestation (branches) that narrow (appear fated) and expand (generating potential) at the same time based upon choice. But many things are done for us so that we don't hang ourselves with our attempt at free choice (for instance autonomic nervous system - you wouldn't want to forget to breathe because you placed it under voluntary choice before going to sleep).
I also believe that it's a mistake to think of these "temporal fields" as efficient causes (Aristotle), that at best what we are dealing with is material causes (or risk factors). But life is not random; just as you can look at a clock and calendar and see that it's 5 pm on a Friday in December, you know the temporal pressure will generate some circumstances and suppress others. For instance the sub set of significations such as "happy hour", "dinner", "snow" generate pressure against sleeping and wearing shorts and generate pressure for skiing. When something manifests from a group of possibilities, the associated other possibilities are given higher probability, whereas dissociated patterns will be depressed to make way for a particular manifestation to stand in relief.
- Curtis Manwaring - Dec 2, 2016